Numba bug hunting series: When 12 threads are slower than 1
I was benchmarking a change in the similarity search module of aeon, and one of my control measurements came out backwards. The baseline, the code that ships today, took 447 ms with one thread and 1157 ms with twelve threads. So it did not just fail to go faster. It became slower, and it did that every time I ran it.
aeon is a Python library for time series machine learning. Almost all of its
hot code is written with numba, which compiles
Python functions to machine code and can run loops on several threads with
prange. When you pass n_jobs=12 to a function, this is the number of numba
threads it will use.
In this post I go from that number to the single line of code that causes it. I also keep the three explanations that I believed for a while and had to drop.
The bug origin
In many places, we use a function to compute pairwise distance between collections of time series (i.e. 3D vectors), called pairwise_distance(X, Y). In this case, I used it with a collection X of shape (n_samples, n_channels, n_timetpoints) and a single query Y(1, n_channels, n_timepoints). This is what any nearest neighbour search does: compare one query against many candidates.
The method argument chooses which distance to use. The ones below are all
elastic distances, which means they can compare two series that are not aligned
in time, by stretching one against the other. DTW is the most known one. They
all work the same way inside: they fill a matrix of m x m cells, where m is
the length of the series, and each cell costs a few operations. So a pair of
series of length 128 means 16,384 cells to compute.
With X of shape (1500, 1, 128) and one query, on a 12 core machine:
| method | n_jobs=1 | n_jobs=12 | scaling |
|---|---|---|---|
| dtw | 280.2 ms | 777.2 ms | 0.36x |
| ddtw | 283.3 ms | 738.4 ms | 0.38x |
| wdtw | 281.5 ms | 767.2 ms | 0.37x |
| erp | 396.6 ms | 746.0 ms | 0.53x |
| lcss | 392.8 ms | 783.4 ms | 0.50x |
| msm | 101.8 ms | 18.1 ms | 5.63x |
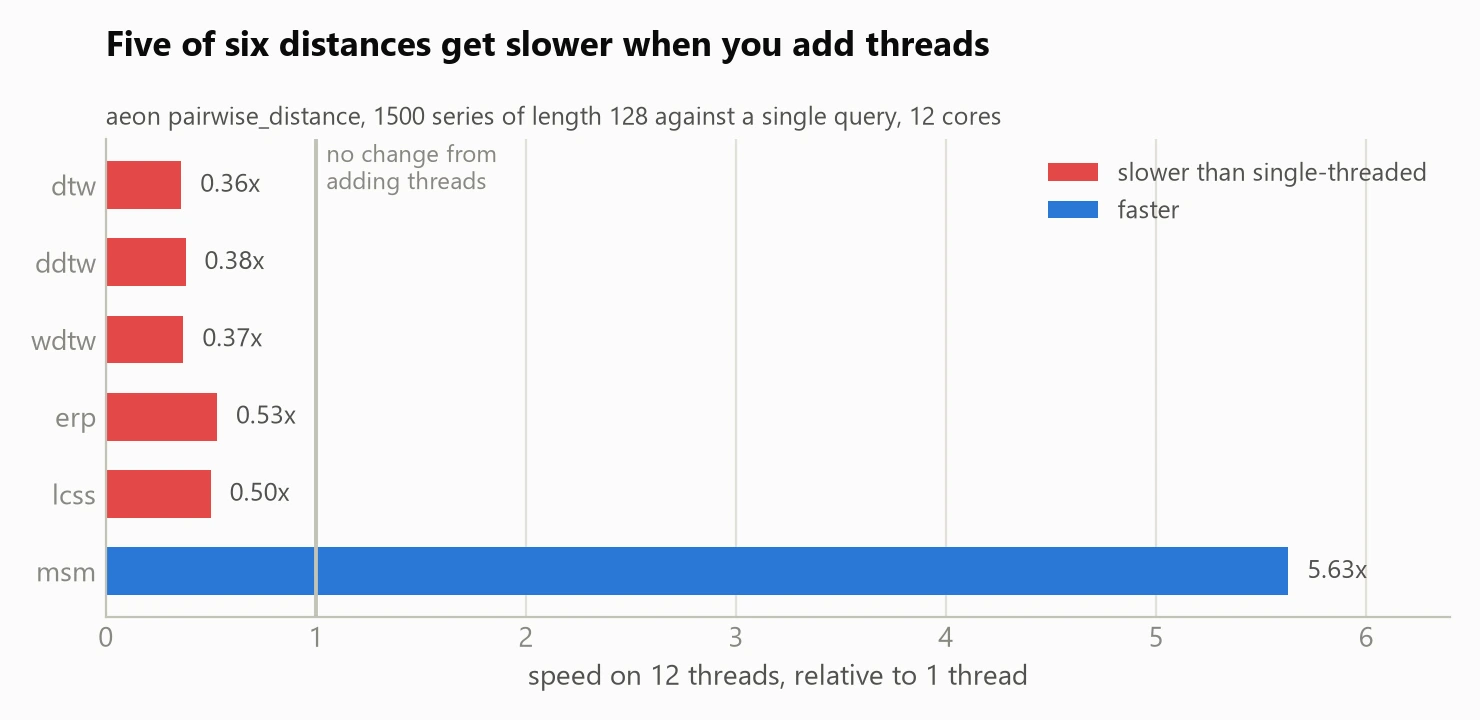 Five of the six distances run slower on twelve cores than on one.
Five distances get worse with threads. One does not. That msm line bothered me
the whole time, and in the end it is what confirmed the cause.
Here are the steps I followed, including the ones that did not work:
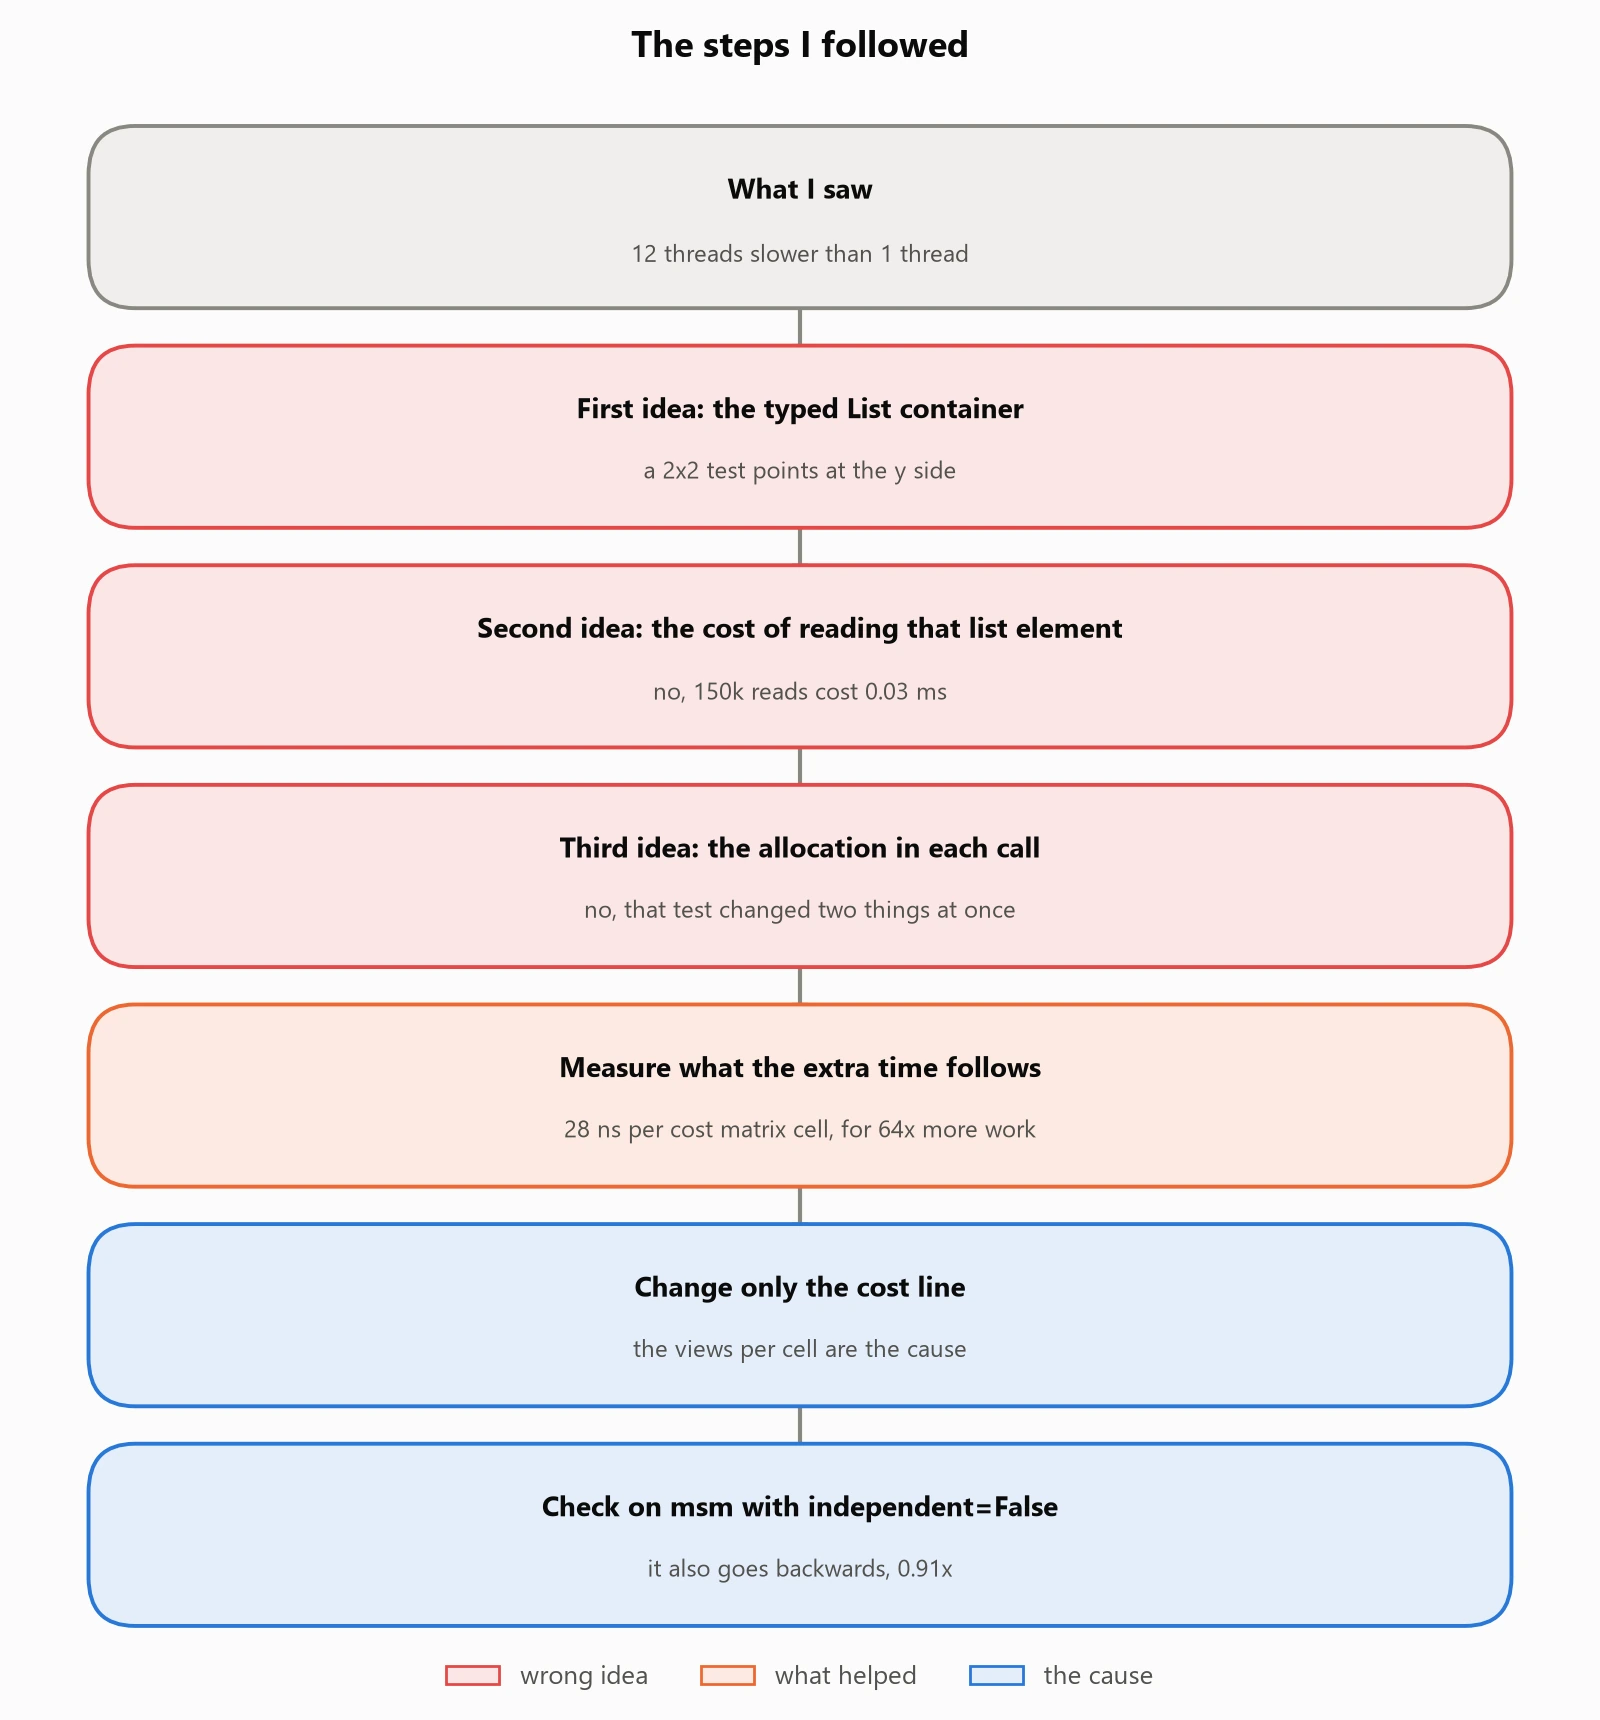 Having some fun with mermaid plots :The steps I followed. Three of them were wrong ideas.
I did two quick checks first. The data does not matter: random walks, normal
noise, uniform noise, and even an array full of the same value all give the
same timings. So it is not a problem of special float values or of branches
that depend on the data. The threading layer does not matter either, because
omp and workqueue behave the same.
First idea: the container
Inside pairwise_distance, the two collections are not given to the parallel
loop as plain numpy arrays. They are converted to numba.typed.List objects,
which is a list type that numba understands. aeon does this because a
collection can also hold series of different lengths, and then a single 3D array
is not possible. The loop looks like this, with prange marking the parallel
loop:
for i in prange(n_cases):
    for j in range(m_cases):
        distances[i, j] = _dtw_distance(x[i], y[j], bounding_matrix)
Here x and y are the typed lists, and _dtw_distance is the compiled
function that fills the m x m matrix for one pair. That container looked
suspicious, so I changed the two sides one at a time.
| X side | y side | 1 thread | 12 threads | scaling |
|---|---|---|---|---|
| list | list | 402.5 ms | 788.6 ms | 0.51x |
| list | array | 272.1 ms | 74.9 ms | 3.64x |
| array | list | 281.8 ms | 714.8 ms | 0.39x |
| array | array | 249.9 ms | 64.4 ms | 3.88x |
The result looked very clear. When y is a typed list, the loop goes backwards.
When y is a plain array, it goes faster with threads. The X side changes
almost nothing.
So I had my explanation. With a single query, every iteration of every thread
reads y[0], always the same list element, so all twelve threads update the
same reference counter. I had a cause, I had a fix (read the element outside
the parallel loop, which gave 10.6x), and I almost stopped there.
Second idea, and why the numbers do not match
When I wrote this down, the numbers did not add up. One contended atomic operation costs around 100 to 200 ns. There are 1500 accesses per call. That gives about 0.3 ms of extra time, and I needed to explain 470 ms. This is a factor of one thousand too small.
So instead of assuming, I measured the access. A prange loop that only reads
y[0] and does nothing else costs 0.03 ms for 150,000 iterations. The read is
free.
Third idea: the allocation
To fill the m x m matrix, _dtw_distance does not keep the whole matrix in
memory. It only keeps two rows, the previous one and the current one, and it
allocates them with np.full at every call. With 1500 calls and twelve threads,
this gives 3000 allocations in a tight loop, and asking the memory allocator for
small blocks from many threads at once is a classic reason for bad scaling. I rewrote the kernel so that it takes the buffers as
arguments, and the extra time went to exactly zero.
I thought this was the answer. But my new kernel changed two things at the same time. It took the buffers as arguments, and it also wrote the channel loop directly instead of calling a function for it. When I tested only the allocation, it was worth less than 1 ms.
I also looked at parallel_diagnostics(level=4) from numba, and the output was
the same for both loops. No allocation hoisting anywhere, nothing hoisted, one
parallel loop each. The compiler was doing the same thing in both cases.
Looking at what the extra time follows
Instead of guessing a cause again, I asked a simpler question: what is the extra
time proportional to? The number of y accesses stays at 1500. The work inside
the kernel grows with m^2. So I changed m:
| m | cells per pair | extra time | extra time per cell |
|---|---|---|---|
| 32 | 1,024 | 42.1 ms | 27.43 ns |
| 64 | 4,096 | 166.9 ms | 27.17 ns |
| 128 | 16,384 | 693.6 ms | 28.22 ns |
| 256 | 65,536 | 2827.8 ms | 28.77 ns |
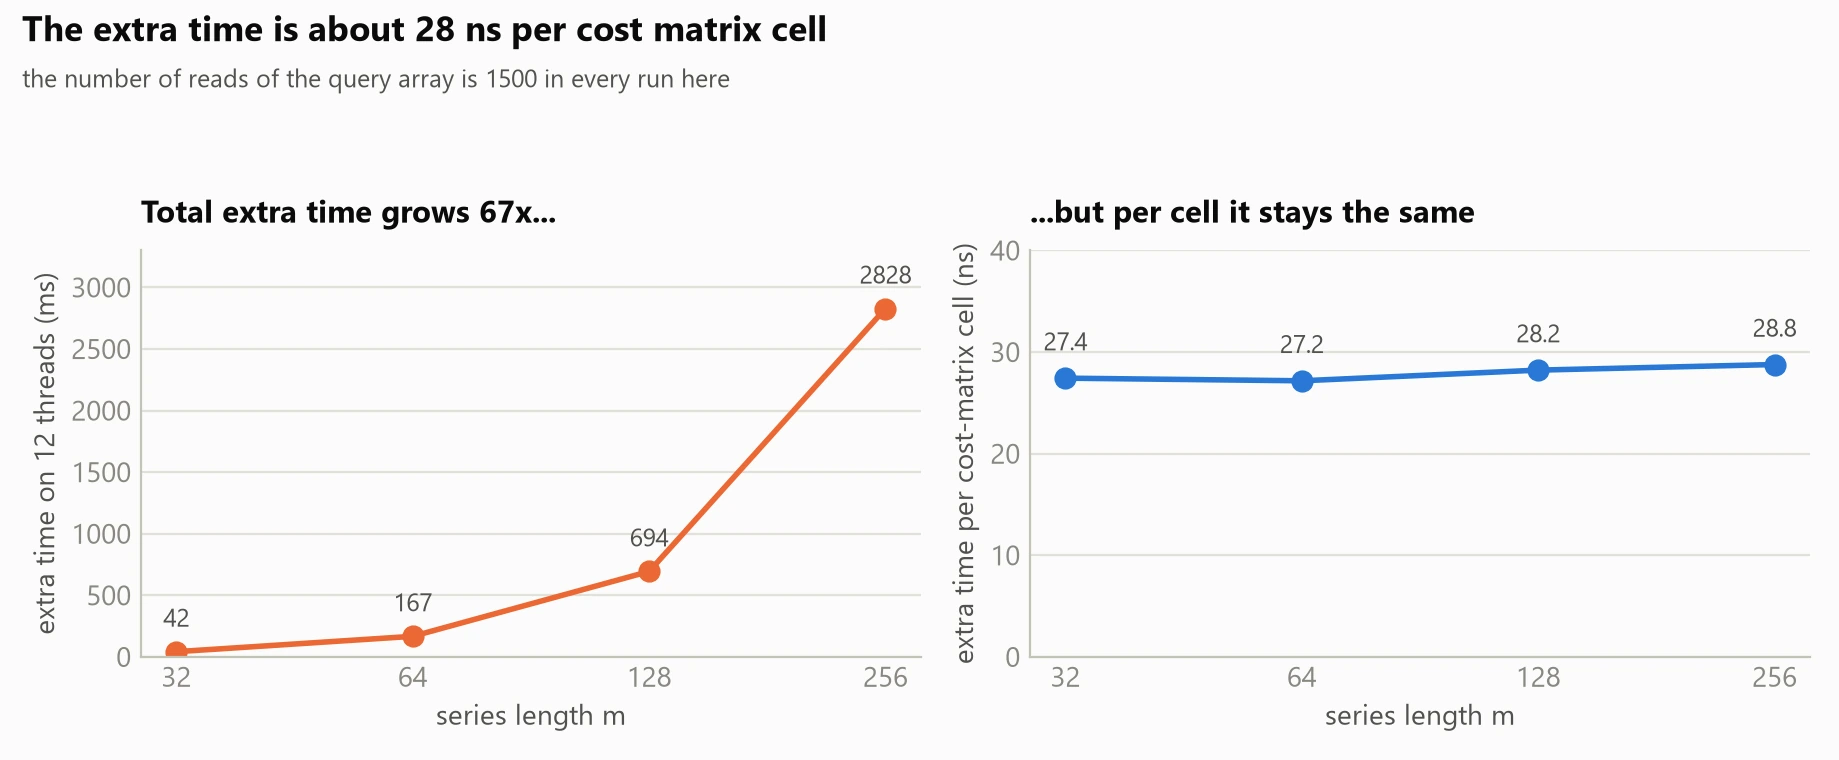 The same measurements, before and after dividing by the number of cells. The
right panel is what made me stop looking for a cost per call.
The same measurements, before and after dividing by the number of cells. The
right panel is what made me stop looking for a cost per call.
It stays around 28 ns per cell of the cost matrix, while the work grows 64 times. The extra time follows the cells, not the list accesses. So whatever this is, it happens once per cell of the DTW cost matrix, and it costs about 28 ns each time.
This small table removes all my ideas about a cost per access. This is why it is better to look for this kind of relation early, not late.
The line that causes it
A series can have several channels, so the cost of one cell is the sum over the
channels of the squared difference. aeon has a small helper for this, and
_dtw_distance calls it for each cell of the matrix:
x[:, i] takes the column i of the series, so all the channels at time i.
This is what gives the helper two 1D arrays to work on.
I wrote two kernels that are exactly the same except for this expression. Same
allocation, same swap logic, same prev[:] = curr[:], same driver with y[j]
read inside the parallel loop:
| cost expression | 1 thread | 12 threads | scaling |
|---|---|---|---|
_univariate_squared_distance(x[:, i], y[:, j]) |
305.8 ms | 743.0 ms | 0.41x |
| channel loop written directly | 82.8 ms | 9.4 ms | 8.77x |
That is 79x on twelve threads, and 3.7x on one thread, for one line.
Why it happens
x[:, i] does not copy the data. It builds a small temporary object that points
inside the original array. Numba needs to know how many things point at each
array, so it can free the memory at the right moment, and the
Numba Runtime documentation
says clearly that this counting is atomic:
"NRT implements memory management for NPM code. It uses atomic reference count for threadsafe, deterministic memory management."
When you build a view, the counter of the parent array goes up by one. When the
view is destroyed, it goes down by one. This counter is one number at one
address. With a single query, all the threads slice the same y array, so
all twelve threads write to the same counter, 16,384 times per pair, so
about 25 million times per call.
A CPU cannot let two cores write the same memory address at the same time. The cache line that holds the counter has to travel from one core to another, one core at a time, and each move costs tens of nanoseconds instead of about one. So the threads wait for each other instead of computing, and more threads means a longer queue. This gives a cost per cell that only appears with threads, which is exactly the shape I measured.
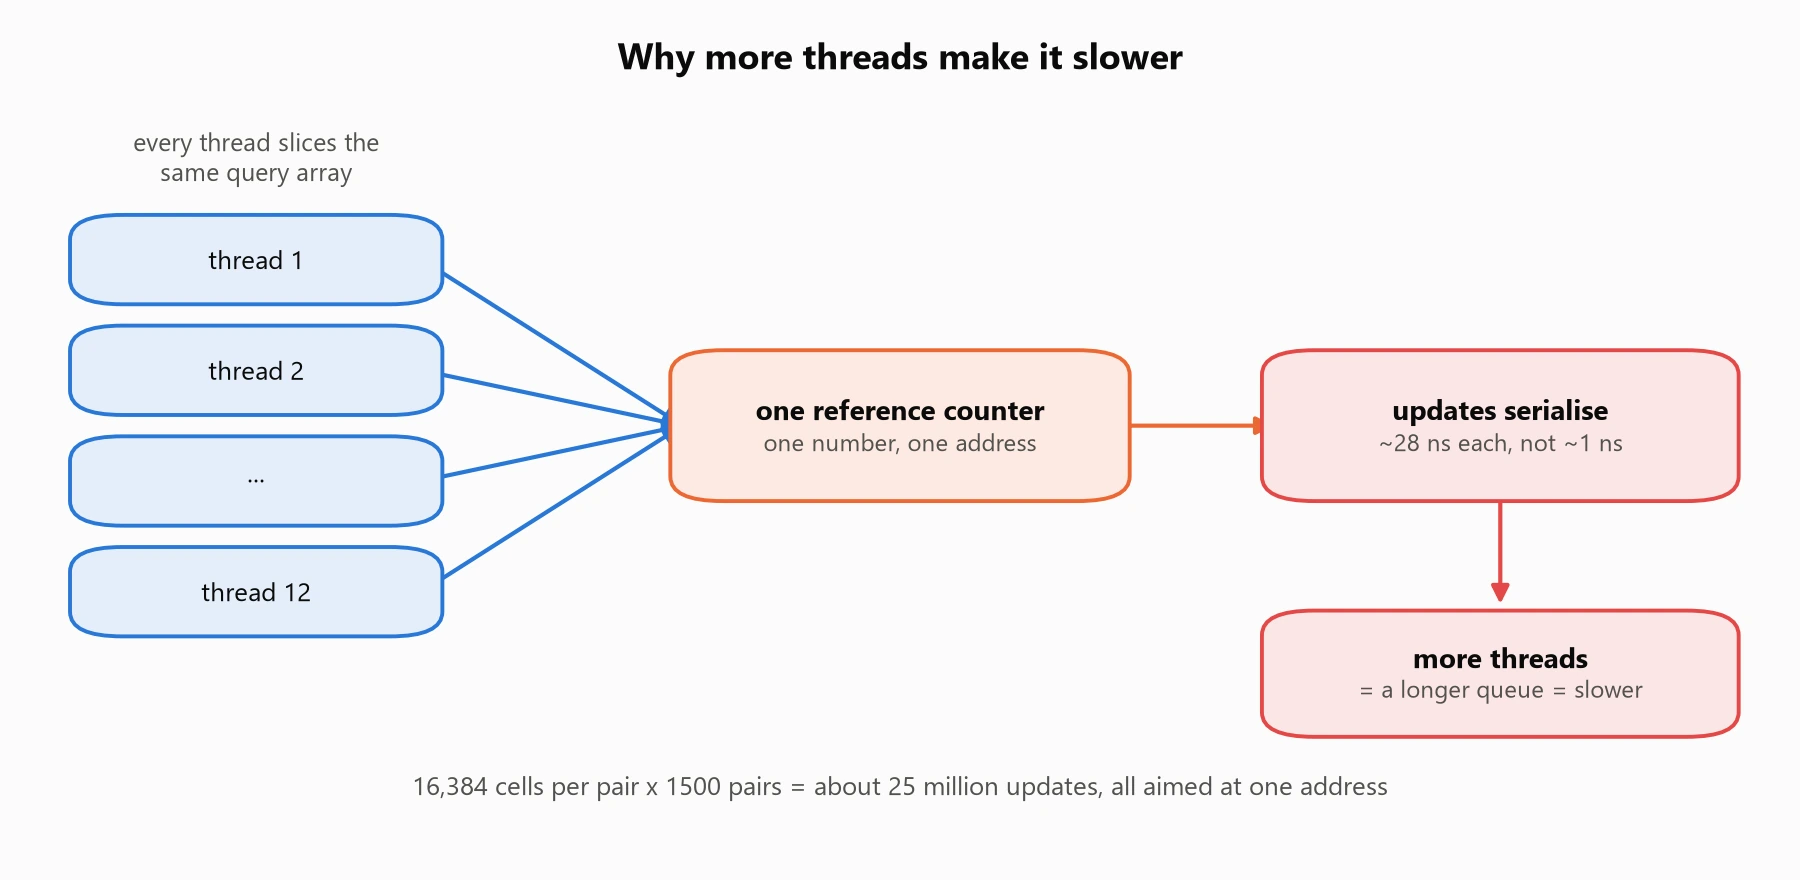 Every thread slices the same query array, so every thread writes to the same
counter.
Every thread slices the same query array, so every thread writes to the same
counter.
Then why does the compiler not remove these useless counter updates? The same page explains it:
"The optimization pass runs on block level to avoid control flow analysis. [...] It works by matching and removing incref and decref pairs within each block."
The pass looks for pairs inside one basic block. Here the increase and the
decrease are on two sides of a call to a function compiled separately, so there
is no pair inside one block, and the updates stay. This is not new:
numba#2345 reports that reference
count removal fails across function calls, and
numba#5904 reports a prange loop
that calls a user function and runs 40x slower than the serial version, while
writing the function body directly makes it 46x faster. Same problem, still
open.
A check on msm
If my explanation is correct, it should also predict something I have not measured yet. So here is what it says.
msm was the odd one that scaled well. It has an option called independent,
which says how the channels are handled. With independent=True, which is the
default, it treats each channel separately, so it slices once per channel before
the cell loop. With independent=False, it treats the channels together and
slices inside the cell loop, exactly like DTW. If my explanation is right,
changing this option should break msm too:
| independent | 1 thread | 12 threads | scaling |
|---|---|---|---|
| True (default) | 199.1 ms | 34.5 ms | 5.78x |
| False | 4470.4 ms | 4923.1 ms | 0.91x |
It goes backwards too. The only distance that looked fine was fine only because its default option avoids the pattern.
The fix, and what it costs
I measured four ways to fix it, and all of them give exactly the same distances:
| variant | 1 thread | 12 threads | scaling |
|---|---|---|---|
A, current: helper(x[:, i], y[:, j]) |
307.5 ms | 752.9 ms | 0.41x |
| B, channel loop written directly | 82.6 ms | 11.8 ms | 6.98x |
C, helper(x, y, i, j), no views |
199.8 ms | 37.8 ms | 5.28x |
D, views plus inline="always" |
138.3 ms | 26.6 ms | 5.21x |
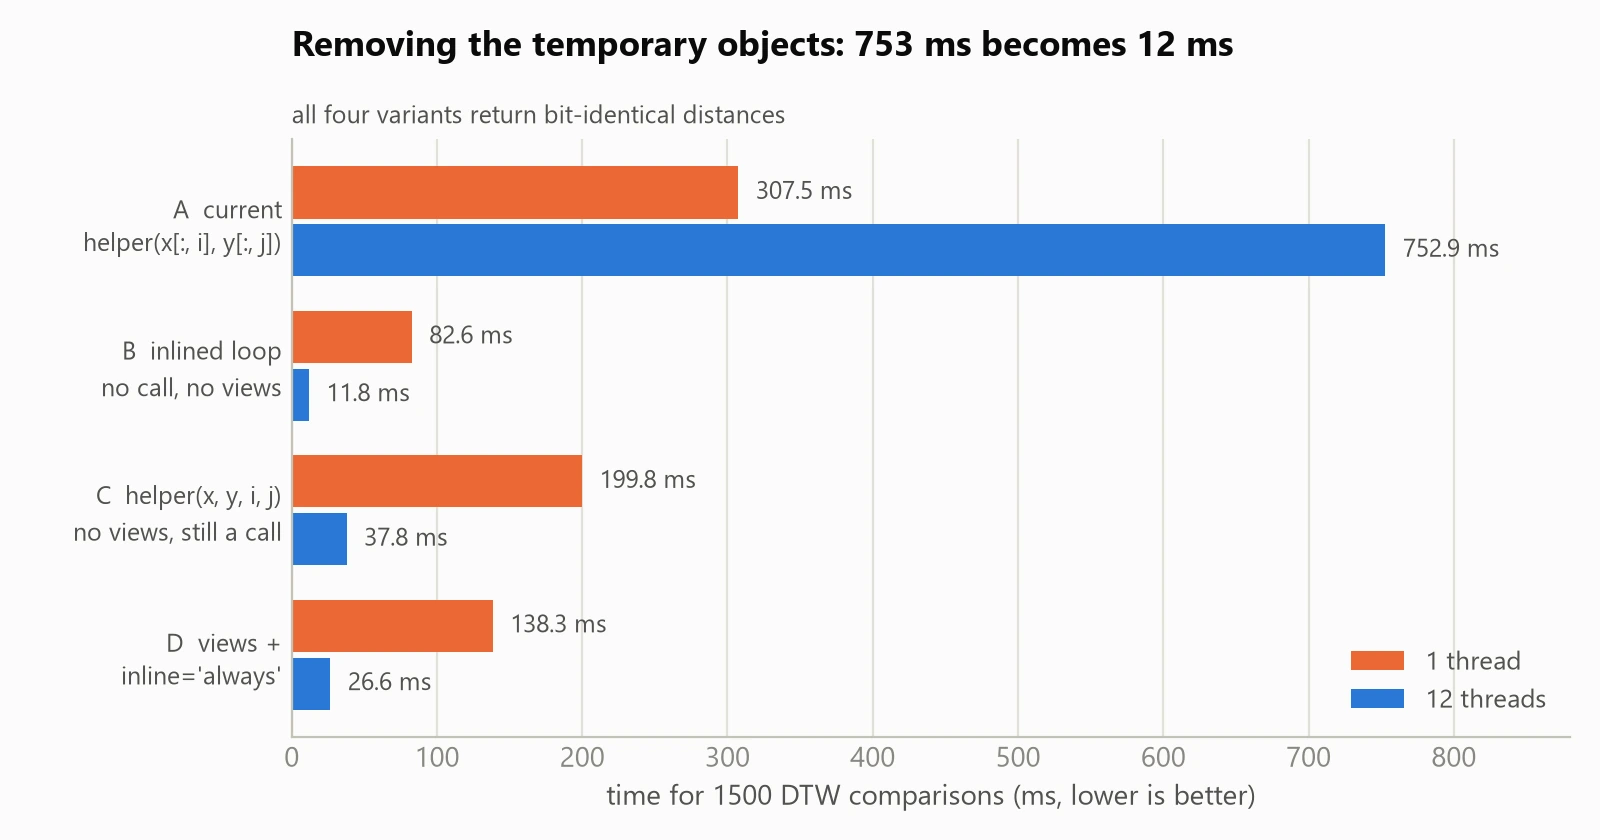 Variant A is the only one where adding threads makes things worse.
The good news is that the three fixes all solve the problem, so I can keep the
shared helper if I want. Variant C keeps one helper for everybody, but instead
of giving it two slices, it gives it the two full arrays plus the indices i
and j, and the helper reads x[c, i] and y[c, j] itself. No temporary
object is built. It is a small and safe change at each call site.
Variant B is 3x faster than C, because removing the call per cell also lets the compiler work on the whole inner loop. So the choice is simple: C is cheap and safe, B is fast but repeats a short loop in several files.
There is one detail that is easy to miss. The original helper uses
min(x.shape[0], y.shape[0]), not x.shape[0]. The number of channels is
always the same when you go through pairwise_distance, but the kernel can also
be called directly, so keeping the min keeps the same behaviour instead of
being right only by luck.
The same slicing pattern appears 11 times in six distance modules of aeon:
_dtw, _twe, _adtw, _erp, _msm, _wdtw. Be careful with _twe, it
uses the euclidean helper, which takes a square root, so you cannot fix it by
copying the squared version.
Does it help to send more queries at once?
A little. The pressure goes down because the work spreads over more counters:
| n_query | us per pair, 1 thread | us per pair, 12 threads | scaling |
|---|---|---|---|
| 1 | 191.1 | 519.9 | 0.37x |
| 2 | 289.6 | 312.3 | 0.93x |
| 8 | 277.6 | 112.5 | 2.47x |
| 50 | 272.2 | 43.8 | 6.22x |
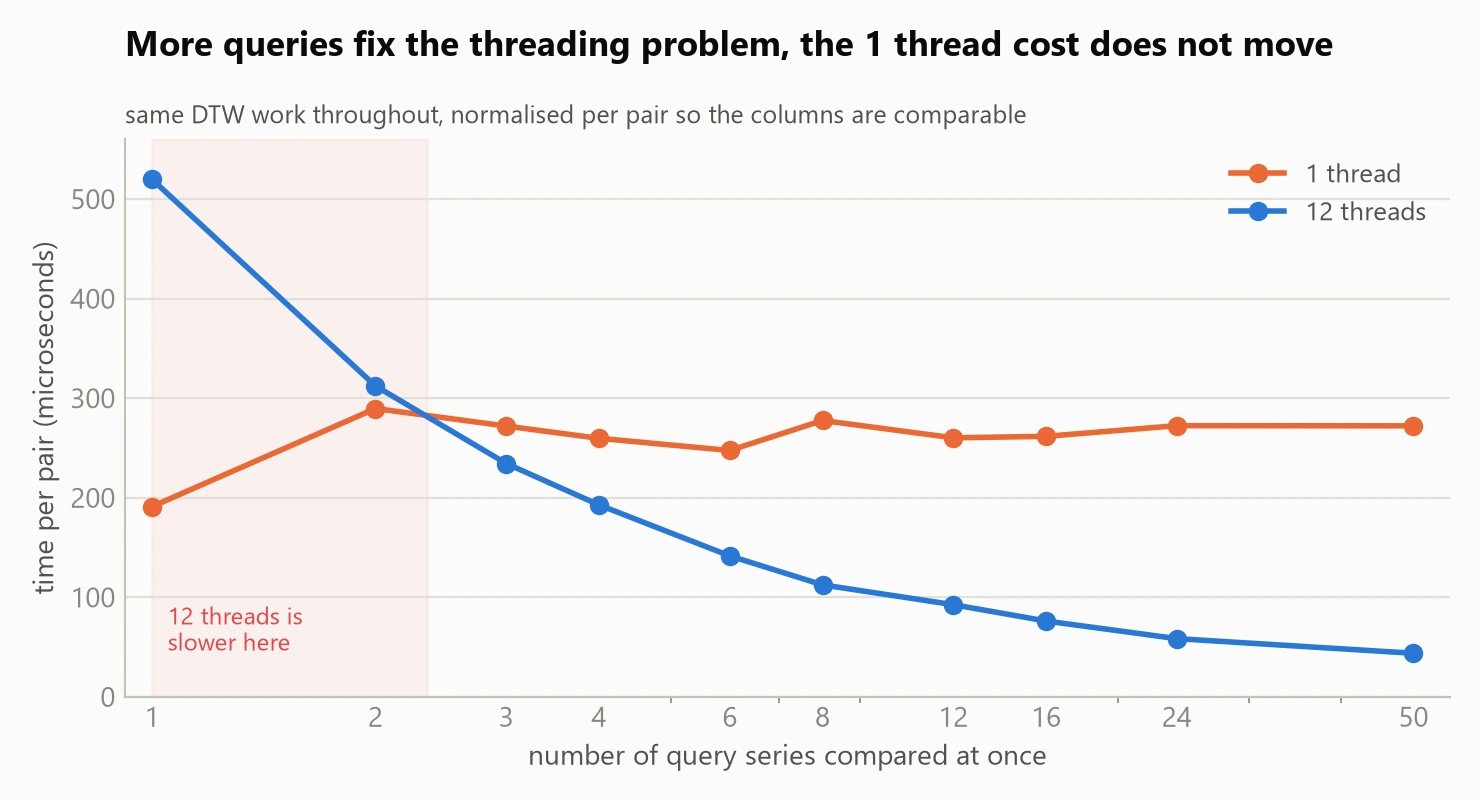 More queries fix the threading problem. They do nothing for the flat orange
line, which is the cost of building the temporary objects.
More queries fix the threading problem. They do nothing for the flat orange
line, which is the cost of building the temporary objects.
It becomes positive at two or three queries. But look at the single thread column: it stays around 270 us per pair, while the kernel without views runs at about 56 us per pair. Building two view objects per cell costs real time even with one thread, and no batching gives this time back. So the slicing costs me twice, and only one of the two costs is a threading problem.
What I would do differently
Look for the scaling law before making theories. The sweep over m took ten
minutes and removed three ideas at once. I ran it fourth instead of first.
Change only one thing per experiment. My buffer test looked like a clean confirmation, but it was not, because the new kernel also changed the channel loop. I lost time on this.
Check that a smaller reproducer still reproduces. While making the script
short enough to publish, I broke it twice. Passing the cost through a closure
let the compiler inline it and the problem disappeared. Passing y as a plain
array instead of a list element did the same. So both conditions are needed:
views per cell, on an array that is read again inside the parallel loop. A clean
script that silently stops showing the bug is worse than no script.
Try to predict something. The test on the msm flag is the only part that
could have proved me wrong, and this is why I trust the result.
What now ?
Now, we'll have to choose how to deal with this bug in aeon ! While the channel loop written directly offers the better speedups, it would also make us duplicate alot of code. This is not ideal when maintaining large amount of code, so we'll probably go for a more maintainable solution (e.g. the helper), as long as the scalling is back.